Integration with PowerBI for dashboarding

I am trying to create dashboards regarding incidents in Power BI.
I have the API key from Pager Duty but I am clueless about the process of how to integrate with Power BI.
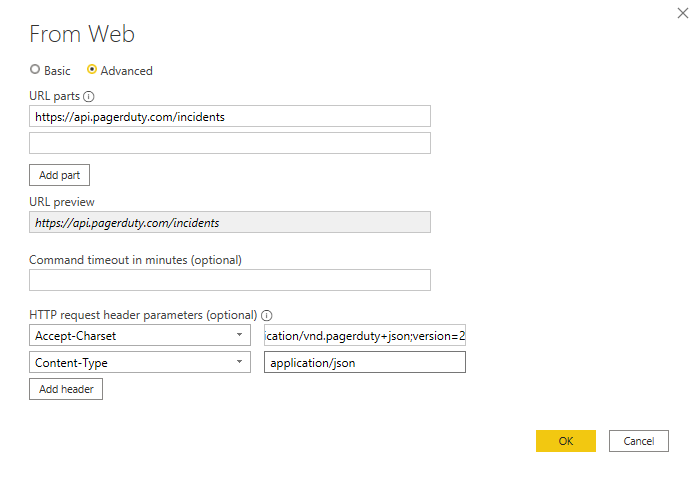
I try to use get data function and enter URL api.pagerduty.com/incidents but I get an error.

If someone could provide me the steps on how to. it would be great.

1 Like

How are you configuring PowerBI’s get data function to query and process PagerDuty incidents?

Doug

I am using Web as source and I enter the URL https://api.pagerduty.com/incidents and hit OK.

Do I need to create a custom connector using powerapps and then get the data from there?

More than likely you’ll need to configure your Power BI connector with the proper headers as shown below:

1 Like

Thanks for the explanation.
I can get the data in Pager duty using these headers but when I enter the same header in PowerBI (Get Data from web) i get this error.


image

Do we need to create a custom connector in Power Apps to pull data from PagerDuty and then import that into PowerBi?

I am new to this, its just little confusing to me.

Thanks!

1 Like

Give it a try without the Content-Type field. I would assume you’ll need something in PowerBI world that can transform the PagerDuty data into a format that maps it in for use. You’ll get all of the raw JSON from the API, and I assume PowerBI would expect table/spreadsheet like columns/rows.

Doug

1 Like

I followed steps as Mr. Amber did, But i got message as unable to connect. let me know how can i proceedunableto%20connect

1 Like

I don’t see the Authorization header listed, did you leave it out on purpose?

I got the connection figured out. Turns out that i just needed a Power BI update.

My next problem is that the /incidents API call only gives top 25 results, how can I get all incident data?

Just 25 incidents data is not helpful for tracking purpose over time and we populate 25 incidents within Hours. Is there a workaround this?

1 Like

Congrats!

Yes, you’ll need to pass in an additional parameter with your query called ‘limit’. With the limit parameter you get up to 100 incidents per query. You’ll also likely need to use pagination so you can iterate and get all of the incidents over your desired time period. Check out this section of our documentation: https://developer.pagerduty.com/docs/rest-api-v2/pagination/

1 Like

Hi Doug,
thank you for the information.

The pagination documentation is very thin and I doubt any person with no experience with scripting will ever understand it because the loop is needed to be programmed in Javascript or python.

Is there a way to find a step by step tutorial on this. I searched google and found barely anything.

I want something like a pagination 101 for dummies because none of my team members in Data analytics department are aware of this process.

If PowerBI doesn’t have support for API pagination, you may need something in front of that to gather and prepare the data for ingestion. It may be best for you to reach out to your PagerDuty Account Team and ask them to set up some time for us to help you in more detail.

Thank You everyone for pointing in the right direction.

I found a resolution for it.

I wrote a script in python that reiterates itself, Anyone looking for a similar issue can use it.

import requests
import pandas as pd   
import json
from pandas.io.json import json_normalize


offset = 0
limit = 100
df = pd.DataFrame() 

while offset <= 9900:
    payload = {'limit': limit, 'offset': offset}

    API_ACCESS_KEY='<YOUR API KEY>'

    headers = {
        'Authorization': 'Token token={0}'.format(API_ACCESS_KEY),
        'Content-type': 'application/json',
        'Accept': 'application/vnd.pagerduty+json;version=2',
        }

    r = requests.get(
                    'https://api.pagerduty.com/incidents',
                    headers=headers,
                    params=payload,
                    )

#print('URL: ', r.url)
#print('STATUS CODE: ', r.status_code)
#print('HEADERS: ', r.headers)
#print('TEXT :', r.text)
#print('CONTENT: ', r.content)
#print('JSON: ', r.json)

    a_json = json.loads(r.content)
    
    dataframe = json_normalize(a_json['incidents'])
    
    print(dataframe)
    
    df = df.append(dataframe)
    
    offset = offset + limit


print(df)

Use this script as source for Power BI data.

Power BI > Get Data > Python Script.

4 Likes

Just wanted to add, I’ve been following this thread for a while for a similar use-case of querying aggregated incident data and I really appreciate you sharing your resolution. Thank you!

1 Like

Hi.!
Your solution is very helpful, but i have a problem with the “offset”.

In your script you have “while offset <= 9900” but power bi can’t process this number and it gets stuck in “evaluating
”

If i change the “while offset <= 9900” to a small number (like 400 or 500 max) it works, but obviously is not much information.

do you have any similar problem?

Regards!